Dual Voltmeter for RV Electrical Systems
This post was written by Brent, one of Crystalfontz’s engineers.
Brent’s Voltmeter Build
I have an RV that has both a vehicle electrical system and a camper electrical system. I wanted a way to see the voltages of both systems at a glance while driving.
I tried some cheesey voltmeters from e-bay and some other cheesey voltmeters from Amazon but I was not happy with the accuracy or stability. I was not able to find a meter that would work well in a vehicle, show two voltages, and have good accuracy.
Time to make my own:
RATIONALE
Why go to the trouble of making my own meter?
- Visibility: I assembled all the van electrics (solar, B2B charger, 400AH LiFePo battery bank, inverter, etc), and while they seem to work fine, it is comforting to be able to keep an eye on them.
- Trust: I wanted a meter that would read really close to my Fluke DMM. This meter does. The various cheesey off-the-shelf meters I got from the usual suspects on eBay and Amazon did not even agree with each other, let alone a DMM.
- History: I love to see the time history of what has been happening in the last few minutes.
- Fun: It sounded like a fun project.
DIFFICULTY
If you have access to a 3d printer and a soldering iron you can build this project. The hardware is pretty straight forward. The firmware is a bit more involved, but you can use the unmodified Arduino source code to get it running.
HARDWARE
First off, I needed a good ADC. After searching around on Digi-Key, I came across the Texas Instruments ADS1115 series, which is a 16-bit ADC with good reference built in. The built-in reference is important – your ADC system will never be better than the reference it measures against. Digi-Key did not have any bare chips in stock so I kept looking. It turns out that AdaFruit and DFRobot make breakout boards for the ADS1115. The breakout board is even better for this application since that would allow me to skip sourcing a board and small SMT soldering. At the time, the DFRobot had stock so that is what I went with.
For the display, I wanted something low power, and also able to be read in the dark. As an employee of Crystalfontz, I was aware of the CFAG12864T3/U3, which has super low power consumption, can be read in sunlight, and has a backlight that makes it readable in the dark.
For a controller I chose the Adafruit Metro Mini 328 – Arduino-Compatible – 5V 16MHz. It is compact, emulates an UNO and is available. Plus, it can be converted to 3.3v logic level which avoids additional voltage changes for the display.
Some short jumper wires.
For the power supply I chose a CUI VX7805-500-W which has a large input voltage range (compatible with automotive supplies, which is not trivial), has high efficiency and a low standby draw, and puts out a nice, clean 5v.
To scale the “12v” automotive (typically 9v ~ 14v) analog inputs to the 5v ADC range, I used 15K + 5K resistors to make a 4:1 divider. This means that a voltage up to 16v can be read. Larger voltages will not damage the ADC input since the 15K resistor limits the current. I used 0.1% tolerance resistors, which to the limit of my ability to measure, are exact. 15K: Vishay / Dale RN55C1502BRE6 . 5K: Vishay / Dale RN55C5001BB14 .
There is also a 5K pot that I used in series with the backlight current limiting resistor so the backlight can be dimmed, which is nice for night driving.
PARTS LIST
- DFRobot DFR0553 ADS1115 ADC breakout board
- AdaFruit Metro Mini 328
- Wide range in, 5v out power converter
- Precision 15K resistor (4x)
- Precision 5K resistor (4x)
- Backlight limiting resistor (typical)
- Backlight dimming potentiometer (typical)
- 128×64 backlit LCD with breakout board (provided by Crystalfontz)
- Short jumper wires (provided by Crystalfontz)
- 3d printed case
- Various solder, heat shrink tubing, etc.
The total cost of the parts was ~$US60 at the time I ordered. All parts used in this build were purchased or supplied free of charge by Crystalfontz for the purpose of creating this tutorial.
WIRING
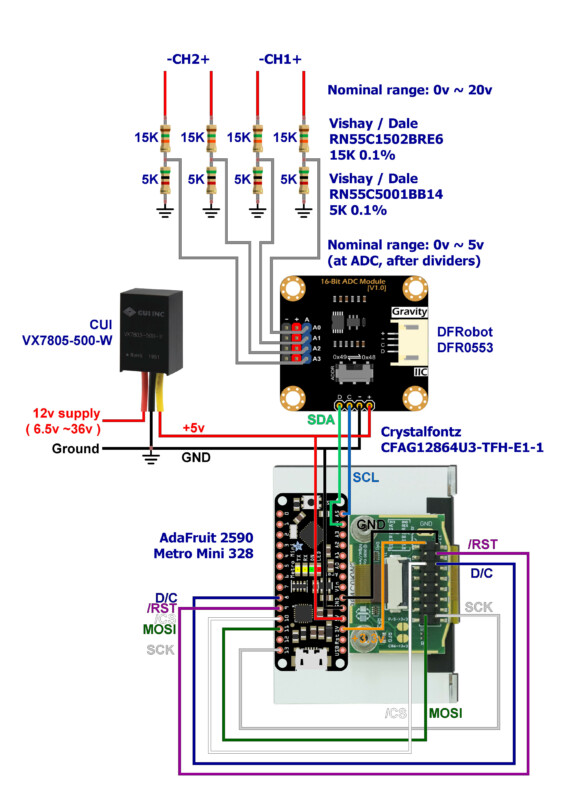
Note: While Brent didn’t do this, we would recommend reducing the I/O voltages from the Metro Mini to the display from 5v down to 3.3v. This can be done by opening the 5v jumper on the back of the Metro Mini and closing the 3.3v jumper. The LCD and the ADC both expect 3.3v logic. Want more information about logic level? Read our post: On the Level: Arduino and Displays
DIFFERENTIAL MODE
Since I only wanted two channels and the four-channel ADS1115 has a differential mode, I ran separate wires to the positive and negative terminals of the vehicle and camper batteries. If your grounds are perfect and there were no noise sources differential mode would make no difference. Using differential mode will ignore any voltage drop on the ground cable and will also help to minimize common mode noise. We are going to try to display millivolts and the automotive environment is plenty noisy, so we want to stack the deck as far in our favor as we can.
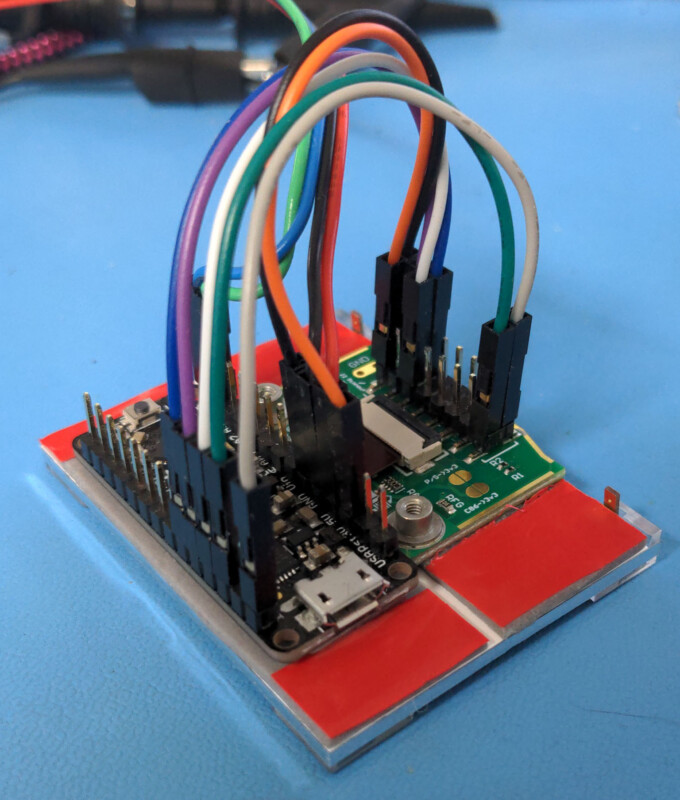
CONSTRUCTION
I mounted the Metro directly to the back of the LCD, alongside the LCD’s interface board:
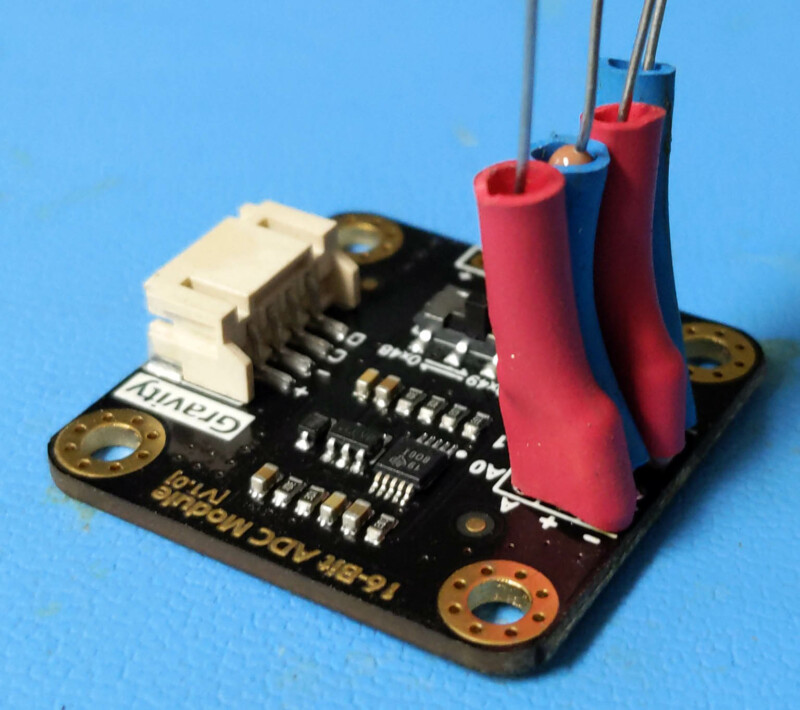
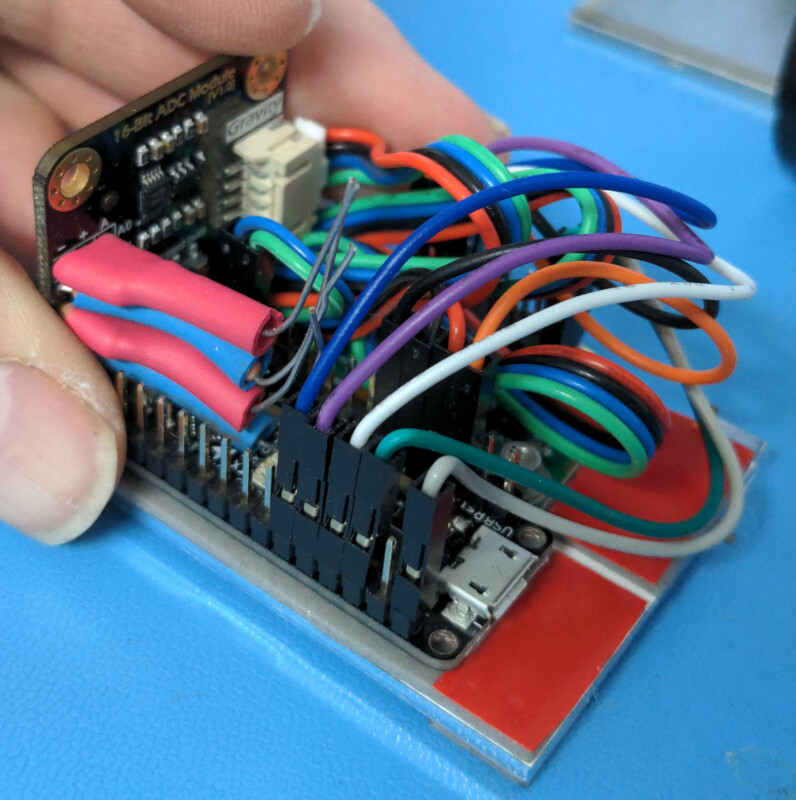
I soldered the voltage divider resistors directly to the ADC board:
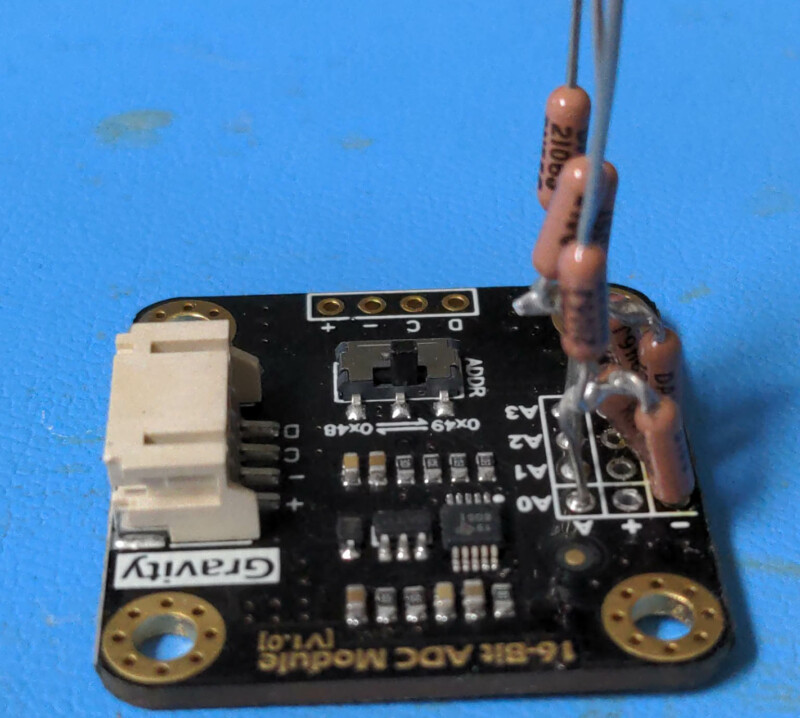
Then used heat shrink to make sure there were no shorts:
The parts fit together in a compact package:
CASE
I made the case in OpenSCAD — which is both fun and frustrating:
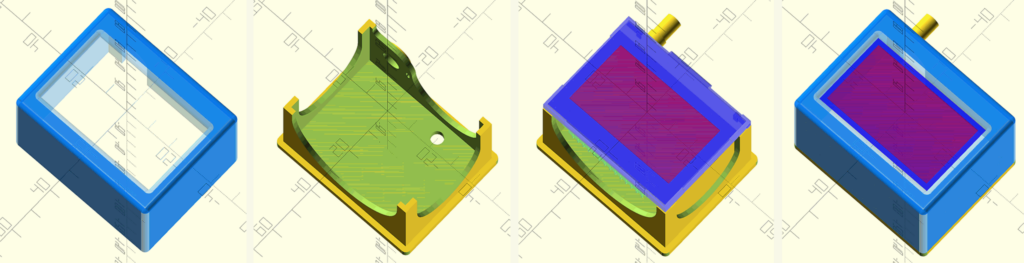
The source and STL files are available here: https://baxsie.com/images/CFA/Dual_Voltmeter/Dual_Voltmeter_Case.zip
Also on Thingiverse: https://www.thingiverse.com/thing:5476060
Then it was just a matter of some 3D Tetris to place all the components into the case. The case front and back are sized so that the ridges of the 3D printing kind of snap it together:
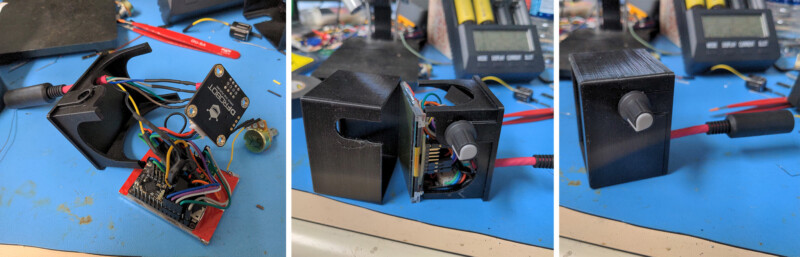
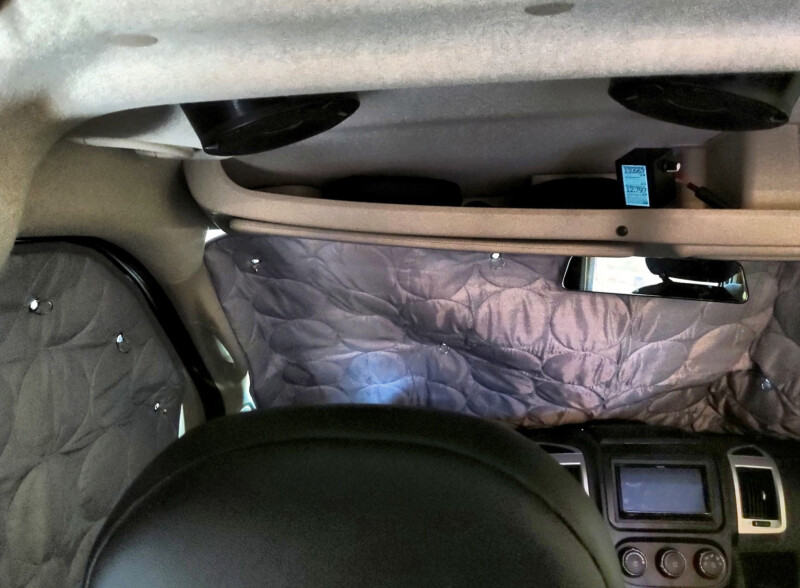
Here is a picture of the completed hardware, mounted in the package tray above the driver seat:
FIRMWARE
As much fun as assembling the hardware is, the real star of this show is the firmware. Here is the full source, which can be opened with the Arduino IDE: https://github.com/crystalfontz/DualVoltmeter
Of course, you can wade through my code and try to figure out what I did, but I will break it into sections and try to describe each section in words that can be understood.
Setting up the ADC
We are using “GAIN_ONE” setting of the ADS1115. This means that each bit represents 1/8 of a millivolt (0.125mV = 125µV). The ADC is 16-bit signed so that gives us a range of -32768 to +32767 ADC ticks which corresponds to -4.096v to +4.096v differential input voltage. Keep in mind that we have a 4:1 divider in front of the ADC so the actual voltage range we can read is -16.384v to +16.384v, which makes each ADC tick is 0.125mV * 4 = 0.5mV.
The basic unit that we will use and store is “half_mv”. As an example, one volt will be 2000 ADC ticks. Each reading can fit in a 16-bit signed integer.
Getting the data from the ADS1115 ADC
We are using the ADS1115 setting “RATE_ADS1115_64SPS”. Each conversion will be complete after 17.5mS.
To keep the code simple and make sure we sample the ADC channels at even intervals, the ADC is read in a timer ISR. The ISR gets hit 40 times a second – every 25mS. The ISR takes about 2mS, so approximately 8% of the processor time is devoted to reading the ADC.
The ISR first reads the ADC’s completed previous conversion, then tells the ADC to start a conversion on the other channel then exits. The ISR reads the vehicle channel, starts the camper channel then exits. Next time it reads the camper channel (which is by now guaranteed to be complete) and starts the vehicle channel. Repeat.
After it has read both channels – which takes two passes through the ISR — 50ms — it lets the foreground know that both channels have new data available.
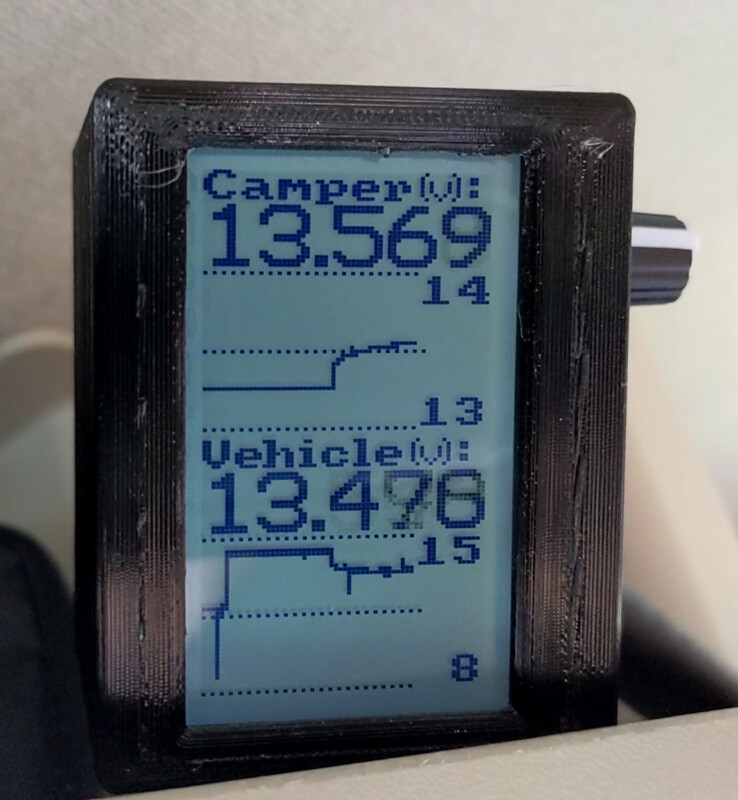
Processing the data for the numeric readout
I want to display the current reading in 5 digits: VV.mmm I’m not using any floating point, so we want to have a number that represents millivolts. Our base data is in half_mv, so we can just divide it by two. However, a straight shift always loses the least significant bit. If we add 1 before the shift then we can get rounding instead of truncation.
One of the problems with a digital display is bobble in the last digit. No matter how perfect the signal, the analog circuit, the ADC, and any amount of averaging, there will be voltage values that switch randomly between two readings. The way to solve it is by implementing hysteresis. You do not allow the new reading to change unless it is a certain number of ticks from the previous reading. By changing that number of ticks, you can settle the display digits.
Here is the code:
int16_t Hysteresis(int16_t ¤t,
int16_t &previous,
int16_t dead_zone_ticks)
{
if(current < previous)
{
//Going down. Is it big enough to make us change?
if(dead_zone_ticks <= (previous-current))
{
//Larger change, move but at the top of the dead band
current+=dead_zone_ticks;
//remember our new base line
previous=current;
}
else
{
//Small change, do not move.
current=previous;
}
}
else
{
//Going up. Is it big enough to make us change?
if(dead_zone_ticks <= (current-previous))
{
//Larger change, move but at the bottom of the dead band
current-=dead_zone_ticks;
//remember our new base line
previous=current;
}
else
{
//Small change, do not move.
current=previous;
}
}
}
I use dead_zone_ticks of 6 so any change within 3mV of the previous reading will not change the display reading. This makes a much more stable and readable display for slowly changing or static readings.
Processing the data for the strip chart
Part of the challenge is to display the data in a way that a quick glance can give me a lot of information about what is going on. To make that work I keep a history that is 47 entries long – this matches the 47 pixel width of the strip chart. Each history entry keeps track of the maximum and minimum readings that have occurred within the sampling period. After the sampling period is complete, the history is shifted one notch and the process repeats.
For my purposes, I like each pixel to represent 2 seconds of data, which gives 1 minute, 34 seconds of history on the graph. This can be changed in the code. Since our sample rate is 50ms, then 2S/50mS = 40 ADC max and min samples get stored in each history entry. Each history entry is represented by one horizontal pixel bar, with the length of the bar being determined by the maximum and the minimum readings observed within those 40 samples.
Automatically scaling the graph area
At first glance, we could make the graph area represent 0v to 17v, which would map nicely to out 0v to 16.384v range. Each of the 39 vertical pixels would represent 17/39 ≅ 0.43 volts. The problem is that the voltage would have to change almost a half of a volt to move one pixel. Most readings would be a straight line.
For screen space reasons, I decided to make the top and bottom scales of the graph area integer volts. I scan the 47 bins in the history and find the global max and global min. Then I take the next larger integer for the top limit, and the next smaller integer from the bottom limit. As an example, if all the readings are above 13 and below 14 then each of the 39 vertical pixels would represent 1/39 ≅ 0.025 volts.
Calculating the bar graph height – no floating point
I never want to use floating point on a tiny processor like the AVR. For most calculations you really do not need to. The trick is to use ratios and use parentheses to force the multiply before the divide. Use 32-bit operations for the intermediate results to make sure you do not overflow:
//Convert from (data_max-data_min) in half_mV land to (y2-y1) land in pixels
min_position_in_pixels=
  ((int32_t)min_half_delta*(int32_t)(y2-y1))/((int32_t)(data_max-data_min));
This gives the pixel coordinate from the half_mv ADC reading in one step without any floating point. The Metro Mini can do this twice, once for the max and again for the min in ~875uS.
Drawing the data on the LCD
To keep drawing simple and fast I use a section of the AVR’s memory as a screen buffer (uint8_t framebuffer[FRAME_HEIGHT_PIXELS][FRAME_WIDTH_BYTES];). Each 64-pixel wide line is stored horizontally in 8 bytes. There are 128 lines. 8*128 = 1024 bytes overall.
I created the background in Photoshop as a BMP:
and converted it to an array by using Image2Code ( https://www.crystalfontz.com/product/image2code ). This is stored in the processor’s flash (images.h):
const uint8_t Background_Bitmap[1024] PROGMEM =
  {
  0xAA,0xAA,0xAA,0xAA,0xAA,0xAA,0x80,0x00,
  . . .
  0x3C,0x00,0x00,0x00,0x00,0x00,0x82,0x00,
  };
At the beginning of every frame, the first thing is to copy the bitmap from flash to the RAM framebuffer:
void logo_to_framebuffer(void)
  {
  // ~ 583uS. Bytes configured correctly using Image2Code -- refer to
  // Image2Code_Settings.png
  memcpy_P(framebuffer,Background_Bitmap,sizeof(framebuffer));
  }
Then I draw in the other elements: the two voltages, two strip charts, and the scales.
To draw the voltages in the large font, first I convert the binary value to a string (Voltage_To_Strings()) then I use put_big_number()to print the string to the RAM framebuffer. The chart scales are similar, except using Scale_To_String() and put_string().
The strip chart is plotted using Strip_Chart().
Once everything is rendered in the RAM framebuffer, Send_Framebuffer_To_Display() copies the framebuffer to the physical LCD (~2.7mS).
Conclusion
I have used this meter on a few trips, and I really like it for keeping an eye on the state of the camper’s electrical system. If you want to read more about other builds, check out vanmargrit.com
Contact Us
If you have any questions, we can be reached at support@crystalfontz.com, we also provide chat and telephone support Monday through Friday during our open hours.
We love to hear about your projects! Find us around the web (YouTube, Facebook, Instagram, LinkedIn, Twitter, Forum) and let us know what you’re working on.

Kelsey is an engineer at Crystalfontz. She graduated from Gonzaga University with a BS in Electrical Engineering. Kelsey’s roles at Crystalfontz include product design, custom parts, customer support, documentation, and product demonstrations.
What our customers say about Kelsey:
“As a new user to the world of LCD electronics, Kelsey has been a Godsend in providing the hand-holding I needed to get my project up and running despite my own efforts at fouling things up! :-)” – Owen M
“Kelsey got me through changing code for a new LCD in only two short emails.” – Phillip V
“The agent that I talked with (Kelsey), is technically sound and she knows what she is doing. The support is what made my job easier to get started with the different display technologies. Thank you!” – Vatsal S